How to Do a Systematic Review and Meta-Analysis: An Ultimate Guide for Beginners
A practical, step-by-step guide to conducting a systematic review and meta-analysis, covering the protocol, search, screening, risk of bias, effect sizes, heterogeneity, and reporting.
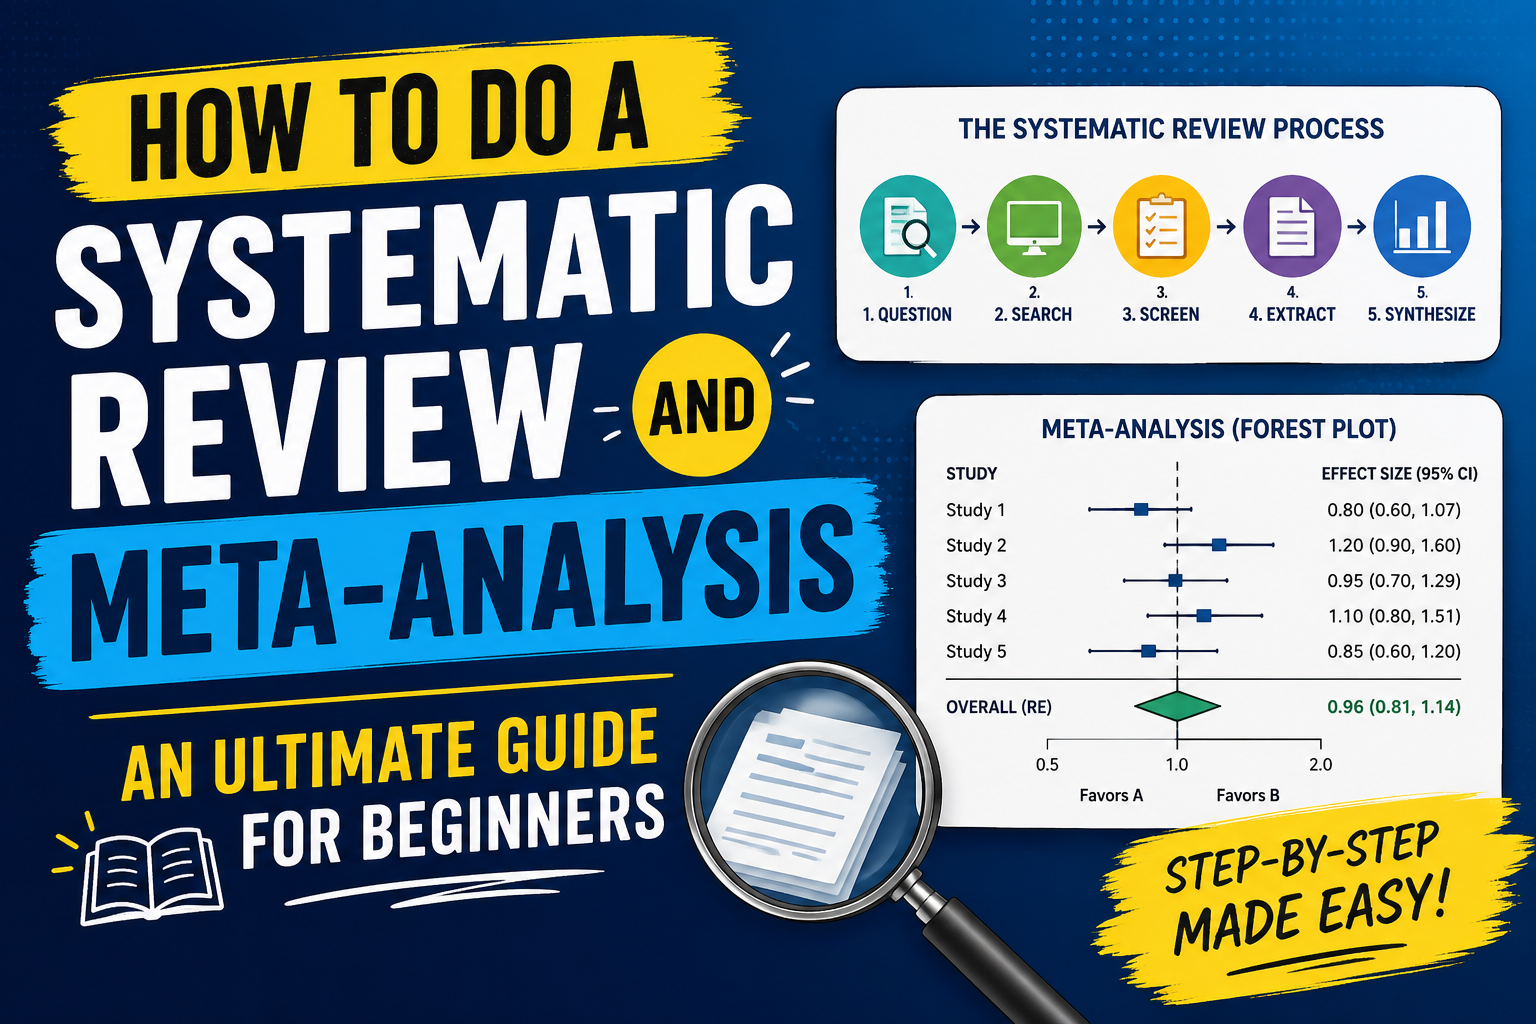
A systematic review answers a focused research question by finding every relevant study through a documented, repeatable search and appraising them against set criteria. A meta-analysis is the statistical step some reviews add on top, pooling the results of those studies into a single estimate. You can run a systematic review without a meta-analysis, but you should never run a meta-analysis without the review that justifies it.
This guide walks through the whole process in the order you'll actually do it, and it stops to explain the parts where most people get stuck: choosing an effect size, reading heterogeneity, and deciding between a fixed-effect and a random-effects model.
Systematic review vs meta-analysis: what's the difference?
The systematic review is the method. It sets a question, defines what counts as evidence, searches for it exhaustively, and appraises what it finds. The meta-analysis is one possible output of that method, a quantitative summary of the studies that are similar enough to combine.
If your included studies measure different things in incompatible ways, you may finish the review with a narrative synthesis and no pooled number, and that is a legitimate result. Forcing a meta-analysis onto studies that shouldn't be combined produces a precise-looking estimate that means nothing.
The steps
1. Turn your topic into an answerable question
A review needs a question narrow enough to answer and specific enough to search for. Clinical reviews usually frame it with PICO: the Population, the Intervention, the Comparator, and the Outcome. A question like "does intervention X improve outcome Y compared with usual care in adults with condition Z" tells you what to search for and what to include. A vague topic like "the effects of X" does not.
2. Write and register a protocol
Write down your methods before you start: the question, the inclusion and exclusion criteria, the databases, the search terms, and how you'll extract and analyze data. Then register it, usually on PROSPERO for health reviews. Registration timestamps your plan, which is what separates a real synthesis from one where the criteria quietly shifted to fit the results. It also stops two teams from unknowingly running the same review.
3. Build and run the search
Search several databases, not one. The exact set depends on your field, but health reviews commonly use MEDLINE or PubMed, Embase, and the Cochrane Library, plus subject-specific databases where relevant. Combine terms for each part of your question with Boolean operators, and record the full search string for every database along with the date you ran it. Reviewers will ask to see it.
Export the results and bring them into one place. Reference managers export in RIS format, and most screening tools read it directly. Deduplication happens here, because the same paper will show up across databases.
4. Screen in two passes
Screen titles and abstracts first against your inclusion criteria, then read the full text of whatever survives. Two reviewers screening independently is the standard, with disagreements resolved by discussion or a third reviewer. Keep a count at every stage: records identified, duplicates removed, records screened, full texts assessed, and studies included, with reasons for each full-text exclusion. Those counts become your PRISMA flow diagram, and they need to add up.
5. Extract the data
Pull the same fields from every included study: sample sizes, the outcome data you need for pooling, study design, and anything you plan to use in subgroup or sensitivity analyses. For a meta-analysis of a continuous outcome you typically need the mean, standard deviation, and sample size per group. For a binary outcome you need the number of events and the total in each group. Extract into a structured form, not a free-text note, so the numbers flow straight into analysis.
6. Assess risk of bias
A study can be relevant and still be unreliable. Appraise each one with a tool suited to its design, such as RoB 2 for randomized trials or ROBINS-I for non-randomized studies. This is not the same as study quality in the abstract sense. It asks a specific question: how much could flaws in this study's design or conduct have distorted its result? You'll use these judgments later to weight your confidence and to run sensitivity analyses that drop the high-risk studies.
7. Run the meta-analysis
If the studies are similar enough, pool them. Three decisions shape the result.
Choose an effect size that matches your outcome. For continuous outcomes measured the same way across studies, use the mean difference. When studies measure the same construct on different scales, use the standardized mean difference, and prefer Hedges' g, which applies a small-sample correction that plain Cohen's d omits. For binary outcomes, use the risk ratio, odds ratio, or risk difference.
Choose fixed-effect or random-effects. A fixed-effect model assumes every study estimates one identical true effect and differences between them are only sampling error. That assumption almost never holds across studies run in different settings with different populations. A random-effects model assumes the true effect varies from study to study and estimates the average of that distribution. The DerSimonian and Laird random-effects method is the common default, and for most real-world reviews it is the honest choice.
Report a prediction interval, not just a confidence interval. A confidence interval describes the precision of your average effect. A prediction interval describes where the true effect is likely to fall in a new setting, which is usually what a reader actually wants to know. It is wider, and that width is information, not a flaw.
8. Read the heterogeneity
Heterogeneity is how much the true effects differ across studies beyond chance. I² estimates the percentage of the variation that reflects real differences rather than sampling error. As a rough convention, values around 25%, 50%, and 75% are treated as low, moderate, and high, but the number is a guide, not a verdict. High heterogeneity does not mean you made a mistake. It means the effect depends on something, and your job is to ask what: population, dose, study design, or risk of bias. Subgroup analyses and meta-regression explore those explanations.
9. Check for publication bias
Studies with striking results get published more readily than those with null findings, which can skew a pooled estimate. A funnel plot shows the spread of effects against their precision, and asymmetry can signal missing studies. Egger's test puts a number on that asymmetry. Neither is proof, and both behave badly with few studies, so treat them as prompts to think rather than as a pass or fail.
10. Rate the certainty and report
Summarize how much confidence the body of evidence supports, commonly with GRADE, which downgrades for risk of bias, inconsistency, indirectness, imprecision, and publication bias. Then report to a recognized standard. PRISMA 2020 is the reporting guideline for systematic reviews, and following it means a reader can see exactly what you did and could repeat it.
How Verflux fits into this
Most of the friction in the process above comes from moving between tools that don't share data. Verflux keeps the workflow in one place: import your search results from RIS or straight from Zotero, screen and deduplicate, record risk of bias with the domains lined up to the appraisal tool you used, run the meta-analysis, and export a PRISMA flow diagram and GRADE summary you can put in the manuscript.
The statistics use the published estimators named above, Hedges' g with the small-sample correction, DerSimonian and Laird for random-effects pooling, and prediction intervals following the Borenstein and Higgins-Thompson-Spiegelhalter approach. You can recompute the numbers by hand and they will match, which is the standard any reproducible review should hold its software to. You can start a review at verflux.com.
Frequently asked questions
How many studies do you need for a meta-analysis? Two is the technical minimum, since you need at least two estimates to pool. In practice, very small meta-analyses give unstable estimates of heterogeneity and unreliable tests for publication bias, so more is better. There is no fixed cutoff, but with only two or three studies a careful narrative synthesis is often more honest than a pooled number.
What is a good I² value? There isn't a target to hit. I² tells you what share of the variation across studies is real rather than random, so a low value means the studies broadly agree and a high value means the effect varies. Around 25%, 50%, and 75% are often labeled low, moderate, and high, but the right response to high I² is to investigate the source, not to force the number down.
Should I use a fixed-effect or random-effects model? Use random-effects unless you have a specific reason to believe every study is estimating the identical true effect, which is rare once studies differ in population or setting. The random-effects model estimates the average of a distribution of true effects, which matches how real bodies of evidence behave.
What is Hedges' g? Hedges' g is a standardized mean difference that corrects the small-sample bias present in Cohen's d. It lets you combine studies that measured the same outcome on different scales. For small studies the correction matters, because uncorrected d overstates the effect.
Do I have to register my systematic review? You are not legally required to, but you should. Registering the protocol, usually on PROSPERO for health topics, records your plan before you see the results and is expected by most journals and reporting standards. It is one of the clearest signals that a review is trustworthy.
What is the PRISMA flow diagram? It is a diagram that shows how many records you found, removed as duplicates, screened, assessed in full text, and included, with reasons for exclusions. It comes directly from the counts you keep during screening, and PRISMA 2020 is the current version of the standard it belongs to.
Start your systematic review today
All analytical features included in the free trial. No credit card, no installation, no R or Python.
Create free accountReferences
- Rehman, N. U., Saif Ullah, K., & Tufail, U. (2026). Verflux: A Browser-Based Platform for End-to-End Systematic Reviews and Meta-Analysis. Verflux Technical Reports, 1, 1-4.